


The modern business is bursting at the seams with data, but making sense of it all can feel like the job of a master mathematician. Because there’s now so much data available, business intelligence applications have become a vital part of a small business’s arsenal of strategic tools.
Business intelligence reporting apps and dashboards bring all company data together, helping you focus on company objectives and react quickly to opportunities. The best part is, the latest generation of business intelligence tools can be used by anyone, meaning you don’t need an IT team — or even have to be technically savvy — to help you make sense of all that data.
There’s also no shortage of business intelligence and dashboard applications to choose from. Many of these are cloud-based solutions that make them cost effective, easy to implement, and simple to scale to your business.
Some of the key benefits of implementing a business intelligence tool for your small business are outlined below, as well as 10 of the best business dashboard apps.
Align the Company
Small businesses generally have very limited resources and offer a limited scope of products and services. By implementing a business intelligence tool, data about your pipeline, your revenue, and your margins can be analyzed in the same way across all departments, which means that everyone can be more focused on your main business objectives.
As SAP’s white paper (PDF), Meeting the Challenges of Business Intelligence for Small Enterprises, puts it: “Continued success lies in getting everyone in the team on the same page by using the same set of assumptions based on the same version of the truth.”
When choosing a business intelligence solution, look for one that offers customizable permissions for reports and dashboards. Departments then have the freedom to control the relevant data they want to analyze while, at the same time, keeping them aligned with the company’s KPIs.
Connect All Your Data
Any business intelligence application worth its salt will contain support for data connectors. Data is strewn across all the various tools and databases that your company uses. Whether it’s website data from Google Analytics, sales data from Salesforce, Facebook activity stats, or customer data stored in SQL databases, everything can be pulled together to help you get a meaningful picture of how your business performs.
Analyze What’s Happening in Your Company Simply and Quickly
One of the biggest payoffs of a business intelligence solution is being able to spot relationships between data sets to analyze how different facets of the business combine to affect performance. You can spot trends and jump on opportunities based on the data you collect.
Custom reports allow you to track performance in a particular area of the business (monthly sales figures, activity on social media channels, etc.). It’s important when choosing a business intelligence application to consider if it supports automatized reporting, as this allows you to receive or send regular reports without having to generate a new report each time.
Many top business intelligence apps offer ad hoc querying, which lets you drill down even deeper into a report to get specific stats about accounts, transactions, or records. Predictive analysis support is another useful feature to look for in a business intelligence tool, as it allows you to forecast performance based on supposed changes in a certain area of the business with a reasonable degree of accuracy.
Get a Visual Overview of Your Business
Business intelligence software lets you create visualizations and dashboards to continuously track and measure real time data. Not only can these dashboards look great, they provide a familiar way for employees to access and interpret data.
When choosing a business intelligence app, check to see if visualizations and dashboards are optimized to run on any device and are embeddable. It’s very useful to be able to share dashboards so that they look and behave the same no matter what platform they’re being accessed on.
10 of the Best Business Dashboard Apps
Choosing the right app is a matter of paying attention to its features and making sure it includes everything you need to pull together all your data, analyze it, and visualize it in a way that suits you. The good thing is, many of these solutions offer free trials or demos, so you can get a feel for them before you make the decision to buy.
Pentaho
Offering data integration, visual analytics, and predictive analytics, Pentaho helps you structure your data to find meaningful patterns.
Cyfe
Branding itself as the ‘All-In-One Dashboard’, Cyfe is a powerful tool for monitoring all of your data from one place, whether it’s from social media, sales, marketing, infrastructure, or anywhere else in your company.
BIME
Boasting a huge set of data connectors, BIME lets you simply plug in your data and perform complex queries very quickly. The app makes it easy to create gorgeous dashboards that are optimized for all devices.
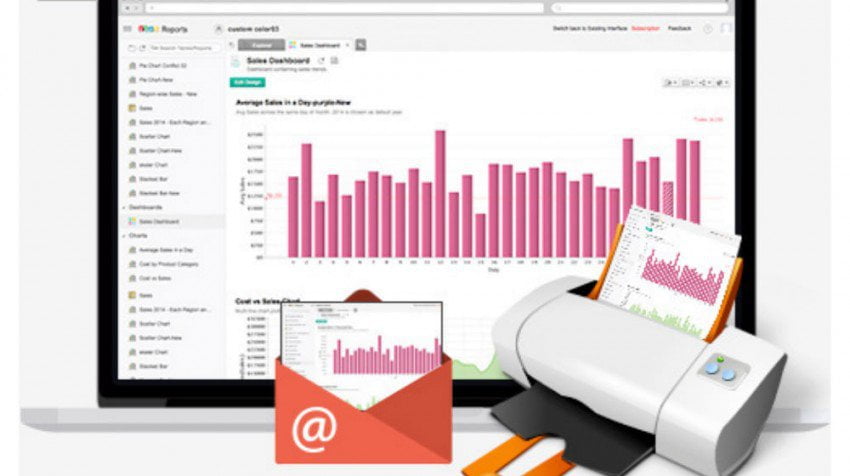
Zoho Reports
Taking the headache out of producing reports, Zoho Reports makes it easy to generate clear, meaningful reports. The app also boasts some very useful sharing and collaboration tools.
SiSense
Billing itself as a business intelligence app for non-tech users, SiSense offers a drag and drop interface for connecting your data, which can then be analyzed via customizable dashboards.
RJMetrics
Aimed at businesses within eCommerce, SaaS, and mobile industries, RJMetrics allows you to consolidate data from your business systems into a central data warehouse, then analyze it through a clear, intuitive interface.
Ducksboard
With support for a wide range of data connectors, Ducksboard offers you the ability to pull your KPIs from each and display it in gorgeous dashboards.
Klipfolio
Heavy on features and low on cost, Klipfolio lets you create clear visualizations from all your data by choosing ‘Klips’ from the suite’s library.
BOARD
Adopting a toolkit approach, BOARD is a self-service solution to help you analyze, report, and understand data.
Looker
Going beyond basic data reporting, Looker allows you to connect to your data in the cloud or on-site to deliver real-time analytics.
Image: Zoho
[“source-smallbiztrends”]